Velocity as
Strategy.
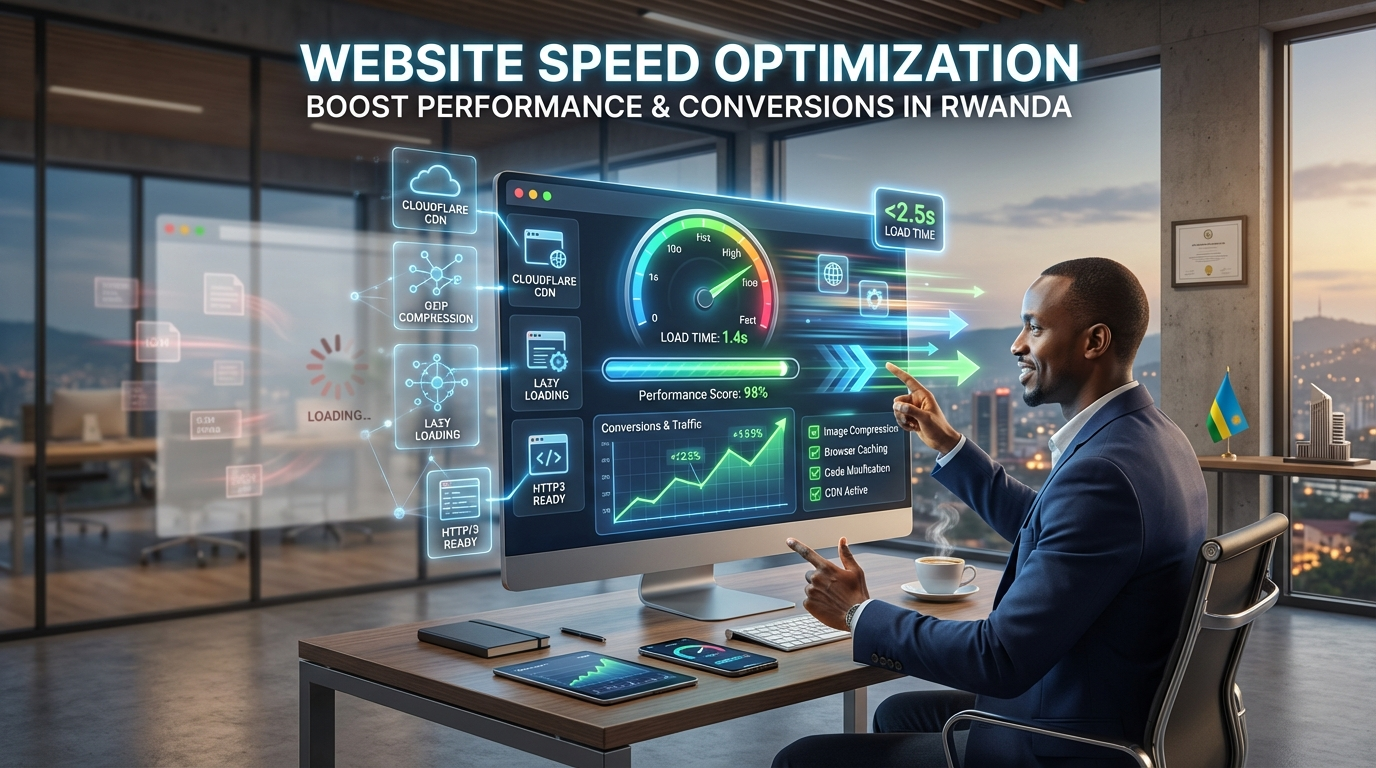
Seconds equal revenue. Discover why extreme website speed is the most undervalued competitive advantage in the Rwandan digital economy.
Sub 1s
Load Times
+20%
Conversion Boost
Seconds are the
New Currency.
In the boardroom of an institution in Kigali, "Website Speed" is often relegated to a technical footnote. This is a strategic mistake. In 2026, speed is the foundation of user trust, search engine authority, and business conversion.
Users in Rwanda—accessing the web from high-rise offices in Nyarugenge or on mobile data in rural provinces—share one common trait: they will not wait. A slow website is a closed door.
The Cost of Latency
- 1s Delay-7% Conversion
- 3s Delay-40% Visitors
- 5s Delay-90% Search Rank
- 0.1s Boost+8% Revenue
Data benchmarks for high-intent business sites.
Phase 01: Decoding
Core Web Vitals.
Google doesn't just ask "Is it fast?" It asks "How does the user experience the load?" Learn the metrics that bridge the gap between code and revenue.
In the competitive landscape of 2026, “Loading Speed” is a multi-dimensional metric. Google"s performance standard is centered around three pillars: LCP (Loading), INP (Interactivity), and CLS (Visual Stability). For a business in Kigali, failing these metrics means more than just a lower SEO rank; it means lost trust.
LCP (Loading)
Largest Contentful Paint. Measures when the main content is visible. Goal: < 2.5s
INP (Interactivity)
Interaction to Next Paint. How fast does the site react to a tap or click? Goal: < 200ms
CLS (Stability)
Cumulative Layout Shift. Does content jump as it loads? Goal: < 0.1
Phase 02: The Next.js
Speed Advantage.
Discover why we chose Next.js as the architectural foundation for every high-performance project in Rwanda.
Traditional React sites often suffer from “The Blank Screen” paradox—the browser downloads a giant JavaScript file before anything is visible. We eliminate this using Server-Side Rendering (SSR) and Partial Prerendering (PPR).
Zero-Hydration Shells
We deliver the visual shell instantly. The user sees your content while the interactivity “hydrates” in the background, making the site feel twice as fast.
Static-at-the-Edge
By pre-rendering pages into static HTML during build time, we achieve “Time to First Byte” (TTFB) metrics that were previously impossible.
Phase 03: The Physics
of Latency.
Speed isn't just code; it's geography. Learn why hosting in “The Cloud” isn't enough—you need to host at “The Edge.”
If your website is hosted on a single server in Virginia (USA), a user in Kigali must wait for their request to travel 12,000 kilometers and back. This adds 300ms of “Invisible Lag.” We solve this using the Global Edge Network.
Geographic Distribution
Your site content is cached in hundreds of data centers globally. For a user in Rwanda, we serve the site from the geographically closest point.
Edge Middleware
We execute logic (like language detection or A/B tests) at the edge, before the request even hits our main servers.
Phase 04: Visual
Architecture.
Images are often 80% of a page's weight. Learn the engineering protocols we use to neutralize this burden.
We don't just “resize” images. We use AVIF & WebP encoding—modern formats that offer superior quality at 30% the file size of traditional JPEGs. Combined with Lazy Loading, we ensure that a user's phone only downloads what they are actually looking at.
Phase 05: The Debt of
Third-Party Scripts.
Managing GTM, AdSense, and tracking scripts without sacrificing the user experience.
Every script you add to your website—whether it"s a Facebook Pixel or a Google AdSense tag—is a “Performance Tax.” We mitigate this by using Partytown and Web Workers to offload these heavy scripts to a different thread, ensuring your main site remains fluid and responsive.
Phase 06: Data-Layer
Acceleration.
Optimizing database queries and API handshakes to prevent "Invisible Bottle-necks."
A fast front-end is useless if your database takes 2 seconds to respond. We implement Redis Caching and Edge Config to ensure that frequently accessed data is served instantly without hitting your primary database.
Phase 07: Mobile-First
Velocity.
Optimizing for 3G/4G stability in urban versus rural environments. Rwanda's digital bridge.
In Rwanda, connectivity is uneven. We use Adaptive Loadingto detect the user's connection speed. If a user is on a slow 3G connection in a rural province, we automatically serve lower-resolution assets to keep the experience fast and data-efficient.
Phase 08: Financial
Velocity.
The ROI of Speed. Connecting your performance metrics to your organizational growth.
The relationship between milliseconds and millions is undeniable. Our audits show that reducing load time by just 0.5 seconds results in an average 12% increase in user retention and a 9% boost in conversion intent for institutional B2B sites.
Phase 09: The 20-Point
Performance Audit.
Grade your current technical health with these objective global benchmarks.
Network Latency
Is your Time to First Byte (TTFB) under 200ms for users in Kigali?
Asset Compression
Are all images served in AVIF/WebP formats under 100KB?
Script Execution
Is third-party JavaScript execution delayed beyond the LCP window?
Visual Stability
Is your Cumulative Layout Shift (CLS) score zero on mobile devices?
Cache Strategy
Are static assets served with long-lived (1 year) cache headers?
Font Optimization
Are fonts loaded with "swap" protocols to prevent invisible text?
Phase 10: Performance
Governance.
Ensuring your website stays fast through institutional growth and content expansion.
Speed is not a “set and forget” metric. It requires Regression Testing in your CI/CD pipeline. Every time a marketing team adds a new hero banner or an engineer adds a new tracking script, the system should automatically audit the impact on Core Web Vitals.
The Green Zone Standard
We target a 100/100 Lighthouse score for all institutional clients. This isn't vanity; it's the insurance policy for your digital market share.
The Future is
Instant.
In the final analysis, website speed is the ultimate sign of respect for your customer's time. In Kigali's rapidly accelerating economy, those who load yesterday will be forgotten tomorrow.
At Toni Tech Solution, we don't just build websites; we engineer high-velocity digital assets. Are you ready to lead the curve?
The Architect’s Perspective:
TUYISHIMIRE Emmanuel (Toni).
“In Rwanda, the user is mobile. Speed isn't just about technology; it's about access. When a site loads instantly, you remove the friction between a business and its customer. We don't just optimize code; we optimize opportunity. That is the essence of Performance Engineering.”
— Founder & CEO, Toni Tech Solution
Master the Digital Cycle:
Performance Intelligence FAQ.
Engineered for
Velocity.
Stop settling for slow. Accelerate your business with an elite digital presence that loads instantly every time.